
"I can't learn just from reading the book. I need to see what it looks like to learn it."
Does this sound like you? Lots of people learn better from seeing than from reading, or they might have trouble understanding complicated info without useful notes. This can make it discouraging to try to learn from reading.
But here's a reading strategy for people who have these problems: use graphic organizers! They help you visualize something that's written.
When to Use Graphic Organizers?

You can use graphic organizers when:
Researching
Compare and contrasting
Examining cause and effect
Below are 3 types of graphic organizers useful for these situations. You should pick one based on what information you're trying to learn.
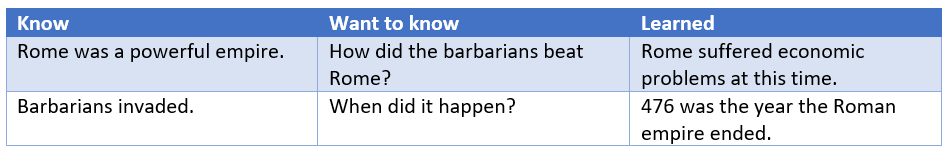
1. KWL Chart
KWL stands for Know — Want to know — Learned.
Use this to decide what is most important to look for when researching, and to build on what you already know.

Follow these steps to fill out the chart:
Know: Write down what you already know about the topic
Want to know: Write down what you want to learn while researching
Learned: Write down what you learned after you've finished reading.
Imagine you need to research about the fall of the Roman Empire. First, you fill out the first two columns. Then, you read an article about 8 Reasons Why Rome Fell to fill out the last column. Finally, your chart looks like this:
To hear an audio description of the KWL chart above, click the play button on the audio player below:
This reading strategy makes it easier to visually compare what you learned and what you already knew.
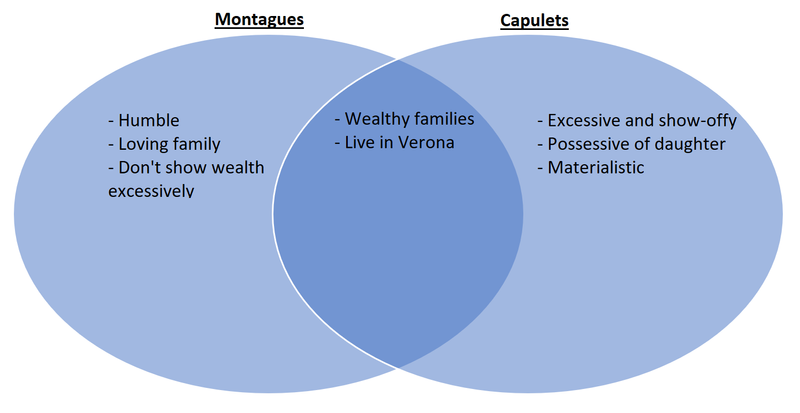
2. Venn Diagram
Venn diagrams can help you make connections between multiple texts, or between facts in one text.
Sometimes you don't see connections between ideas or events until you can see them.
 Photo by John Barkiple on Unsplash
Draw two or three circles. Give a label or category to each of them, and fill them with relevant facts. Then, write common facts in the overlapping parts of the circles.
Here's an example Venn diagram comparing and contrasting the Montagues and Capulets, the two families from Romeo and Juliet.
 To hear an audio description of the Venn diagram above, click the play button on the audio player below:
Subscribe for more quick bites of learning delivered to your inbox.
Unsubscribe anytime. No spam. 🙂
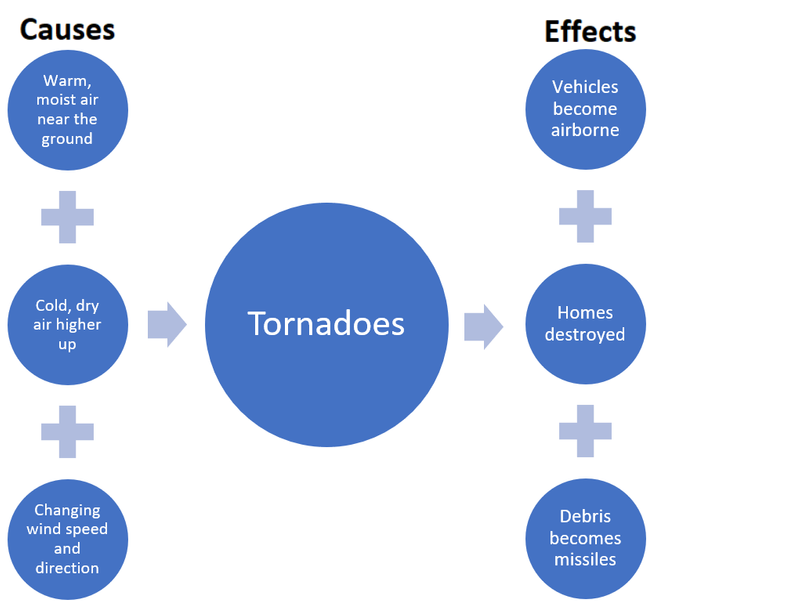
3. Flow Chart
Flow charts show cause and effect. You can use them to easily see how one thing caused something else. They make it easier to understand a sequence of events.
It can be hard sometimes to understand how one part of an event connects to another to create a complete picture.
 Photo by Hans-Peter Gauster on Unsplash
Take those confusing parts and put them into a simple visual.
Here's an example of a natural process, using research from the National Weather Service:
 To hear an audio description of the flow chart above, click the play button on the audio player below:
Using this reading strategy helps you understand the causes and effects described in those sources.
Quiz
Imagine you're majoring in American history and you're doing research on the American revolution. Which graphic organizer would probably be most useful?
Take Action
Put your new knowledge of graphic organizers to use!
Pick one of the graphic organizers we've just looked at and use it to learn something new.
 Photo by Firmbee.com on Unsplash
Your feedback matters to us.
This Byte helped me better understand the topic.