
Data is everywhere around you! So how can you start learning data analytics with excel?

After collecting accurate data, you can find the root causes of issues, predict trends, and make smart decisions. This process is called data analytics and many employees in the workforce use Excel to help them analyze the data they collect for their work.
Why Is Data Analysis Important?
Let's say you want to work for a research university or data-driven company as a data analyst or data scientist. Learning how to analyze data with Excel would make you a more competitive candidate for the job.
 Photo by Luke Chesser on Unsplash
In fact, by 2025, almost all employees across many sectors and fields will leverage data to optimize their work. That's why many employers are boosting their teams’ data literacy and bringing new blood with advanced data skills, such as data analytics with excel, to the teams.
Did you know?
What Type of Data To Get and How?
Data are individual facts, statistics, or items of information, often numeric.
Quantitative Data
numerical
can be measured

Qualitative Data
categorical and descriptive
can't be measured

Quantitative data is usually preferred for data analytics in Excel. You can gather quantitative data through polls, surveys, observations, experiments, and interviews.
Formulas for Data Analytics with Excel
 Use formulas to find the sum, average, minimum, and maximum of the collected data.
Amelia uses Excel formulas to manage her clothing store.

She uses the SUM formula to calculate the total sales as follows:
Select the empty cell B7 (where the total amount will appear)
Enter a SUM function by typing =SUM(B2:B5)
Press Enter to get the total sales
She uses the AVERAGE formula to calculate the average sales as follows:
Select the empty cell B7 (where the average amount will appear)
Enter an AVERAGE function by typing =AVERAGE(B2:B5)
Press Enter to get the average sales
She uses the MIN formula to find the minimum sales as follows:
Select the empty cell B7 (where the minimum amount will appear)
Enter a MIN function by typing =MIN(B2:B5)
Press Enter to get the Min sales
She uses the MAX formula to find the maximum sales as follows:
Select the empty cell B7 (where the maximum amount will appear)
Enter a MAX function by typing =MAX(B2:B5)
Press Enter to get the Max sales
Subscribe for more quick bites of learning delivered to your inbox.
Unsubscribe anytime. No spam. 🙂
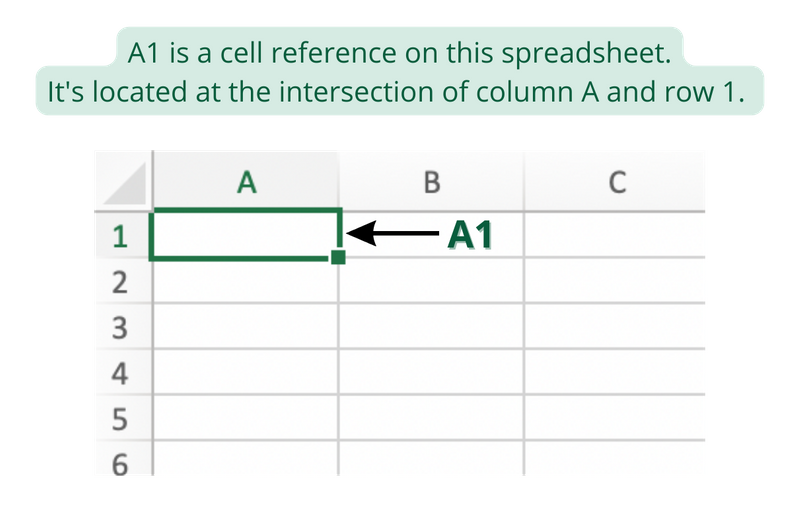
Cell References in Excel
What is a cell reference?
A cell reference is a combination of a column letter and a row number that identifies a cell on a spreadsheet.
There are two types of cell references:
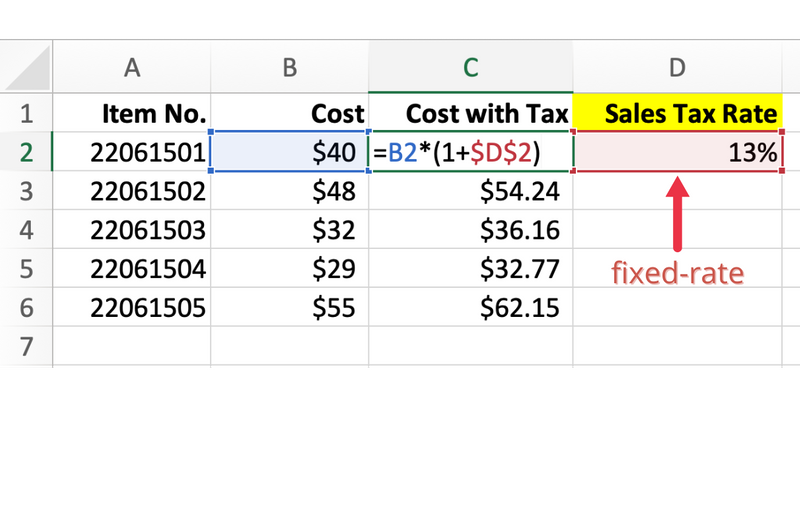
Relative references
Absolute references
What's the difference?
Relative references change when a formula is copied to another cell.
Absolute references remain unchanged wherever they're copied.
Watch this video to learn how to use these two types of references.
Amelia, the clothing store owner, uses cell references in Excel when calculating item costs after tax.

Visualization: Data Analytics with Excel
Create charts to visualize your data for reports or presentations.
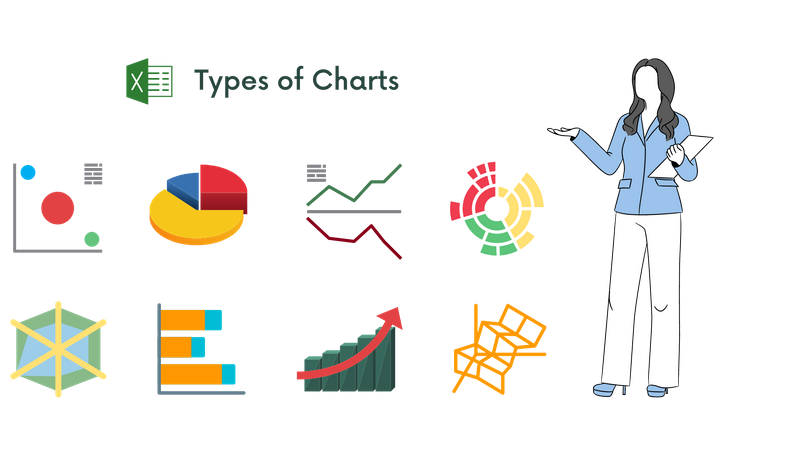
Take a closer look at the most common chart types:
A pie chart shows the proportion of items to the total.

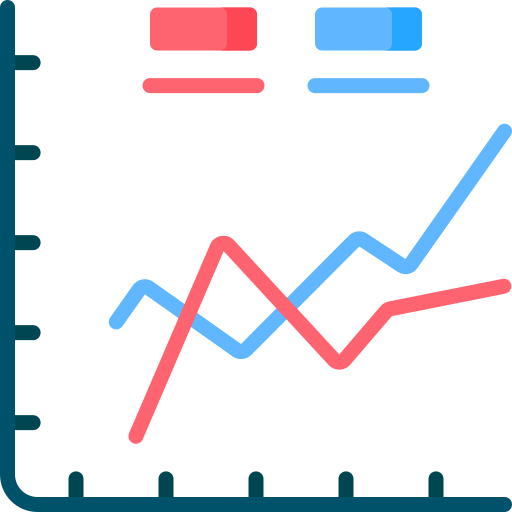
A line chart shows continuous data over time.
A bar chart typically displays values along the horizontal axis and categories along the vertical axis.

A column chart typically displays values along the vertical axis and categories along the horizontal axis.
Creating charts in Excel is so easy!
Select all the rows and columns you want to tabulate in your charts (A1:B7 for the chart below)
Select Insert > Recommended Charts
Select a chart from the drop-down menu
Adjust the size of the chart
Quiz
Bella works for a retail store. Her manager asked her to report total retail sales over the past 10 years. She's going to visualize data with a chart in Excel in the meeting. What chart would be the best option?
Take Action

Practice mastering Data Analytics with Excel!
Try these steps to get started:
Your feedback matters to us.
This Byte helped me better understand the topic.