
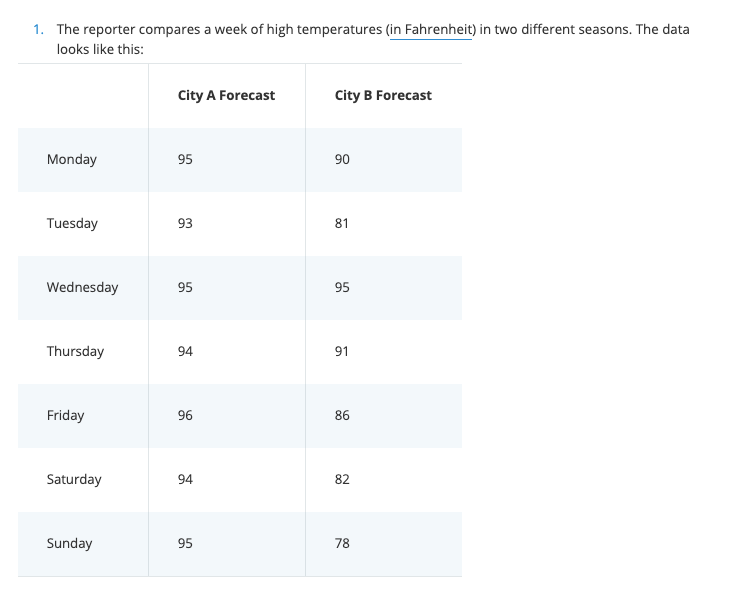
"How would you determine if the weather forecast of City A is more reliable than the weather forecast of City B or vice versa?"
You would calculate the standard deviation of City A and City B weather forecast data sets.
But what's standard deviation in the first place?

Definition Of Standard Deviation
Standard Deviation (represented by the symbol sigma, σ) shows how much variation or dispersion (change) exists from the average (mean), or expected value. It is a measure of the average distance between the values of the data in the set and the mean.

How Standard Deviation Affects Data Sets?
There's two different kinds of standard deviation: small and large.
A large standard deviation indicates:
Data points are further away from the mean.
In terms of experimentation, a large standard deviation means that the range of data points is wide and thus, the experiment is harder to replicate and the measurements are less precise.
A small standard deviation indicates:
Data points are clustered around the mean.
In terms of experimentation, a small standard deviation means that the range of data points is narrow and thus, the experiment is easier to replicate and the measurements are precise.

Quiz
A small standard deviation within the data means that there is less variability within the data set
How To Calculate Standard Deviation?
The following video shows how to calculate standard deviation by using a formula:
Formula to calculate standard deviation is:
 Source: Google Images
If you are extrapolating conclusions from the data set and treating it as a generalizable sample - use n-1
If you are using standard deviation to simply quantify and no extrapolation - use N.
Steps to calculate standard deviation:
Calculate the mean.
Subtract the mean from each data point.
Square each difference.
Calculate the mean of squared differences.
Take the square root of value obtained in Step 4.
Subscribe for more quick bites of learning delivered to your inbox.
Unsubscribe anytime. No spam. 🙂
The Empirical Rule
The empirical rule, also referred to as the three-sigma rule or 68-95-99.7 rule, is a statistical rule which states that for a normal distribution, almost all observed data will fall within three standard deviations (denoted by σ) of the mean or average (denoted by µ).
For such data, which occurs only for large number of samples (N>20), the standard deviation has the following meaning:
68 % of the data would fall within the range of one standard deviation of the average.
95% of the data will fall within the range of two standard deviations.
99% of the data will be within three standard deviations.
Source: https://i.insider.com/546e68776bb3f74f68b7d0ba?width=750&format=jpeg&auto=webp
Quiz
95% of the data will fall within the range of one standard deviation
Why Study Standard Deviation?

Product Manufacturing & Quality Control:
It's essential that car tires that are 2 centimeters in diameters have a small standard deviation to ensure the tire fits appropriately and the car may run without any manufacturing issues! In such a case, measuring the standard deviation is key.
Finance:
Standard deviation is often used as a measure of the risk associated with price fluctuations of a given asset (stocks, bonds, property, etc. ), or the risk of a portfolio of assets.
One of the most important ratios in portfolio management, Sharpe Ratio (for which William Sharpe got a Nobel Prize) uses standard deviation to measure risk-adjusted return (and hence provides incentives to portfolio managers to generate return by taking minimum risk).
Survey Research:
If respondents provide data points with high standard deviation, it decreases the reliability of the research.
Back to.... Weather City Forecast
"How would you determine if weather forecast of City A is more reliable than weather forecast of City B or vice versa?"
Quiz
The temperature is measured in degrees:
Continued...
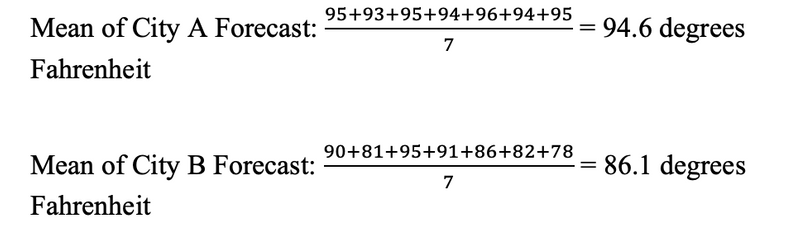
Calculate the mean of both cities' weather forecast

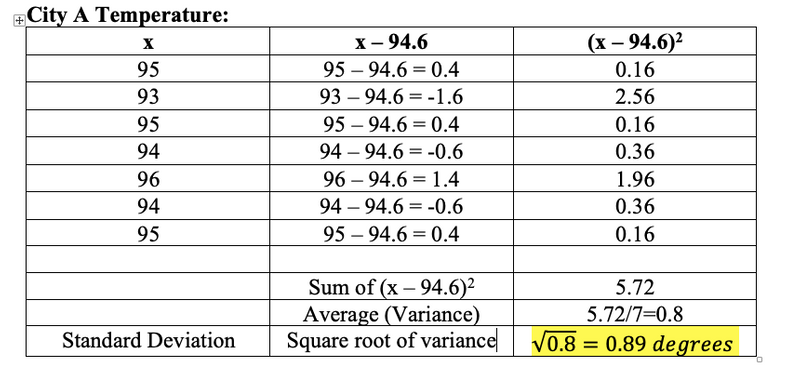
Calculate the standard deviation of City A weather forecast
Calculate the standard deviation of City B weather forecast
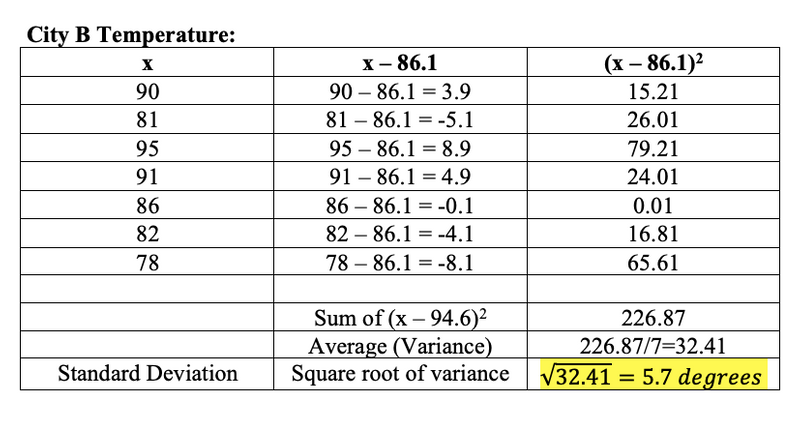 The standard deviation of City A weather forecast is 0.89 degree Fahrenheit, whereas the standard deviation of City B is 5.7 degree Fahrenheit. This shows that City A has a more reliable weather forecast than City B because it has a smaller standard deviation.
Take Action

During data analysis, make sure to calculate:
Your feedback matters to us.
This Byte helped me better understand the topic.