
![]()
Graphs are used widely in our everyday lives: in business, politics and media.
If we aren't thinking critically, graphs can be misleading.
Understanding whether the information given through graphs is reliable or biased, will help us make informed decisions.
Review Of Graph Elements
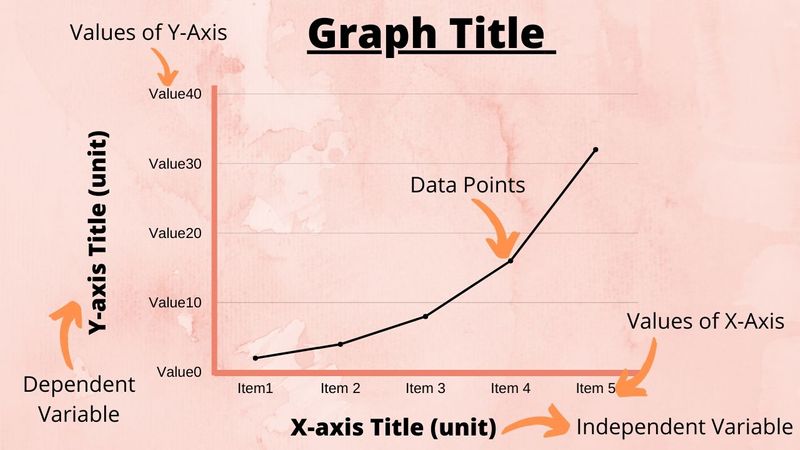
The key elements of a graph are the:
Graph Title: Describes the x-axis and y-axis.
X-Axis: Contains independent variables (variables who do not depend on any other variable) plotted on the horizontal line.
The X-Axis title consists of the name of the variable and the unit it's measured in.
Y-Axis: Contains dependent variables plotted on the vertical line.
The Y-Axis title consists of the name of the variable and the unit its measured in.
Data points: Shown visibly on the graph.
Quiz
Where would you put the dependent variables on the graph?
Video Summary: Common Graph Misrepresentations
Y-Axis Manipulation: Manipulating the Y-axis (making the scale bigger or smaller) misleads by exaggerating the statistics.
Inconsistent Scale: The data value of one point from another in the graph is inconsistent, so it's easier for the reader to miss out the difference between value points.
Leaving Out Relevant Data: The graph only shows the trend within the data range and leaves out the big picture. People often mistake the information presented and assume the graph trend shown is the whole truth presented to them.
Quiz
What to look out for when reading graphs?
Subscribe for more quick bites of learning delivered to your inbox.
Unsubscribe anytime. No spam. 🙂
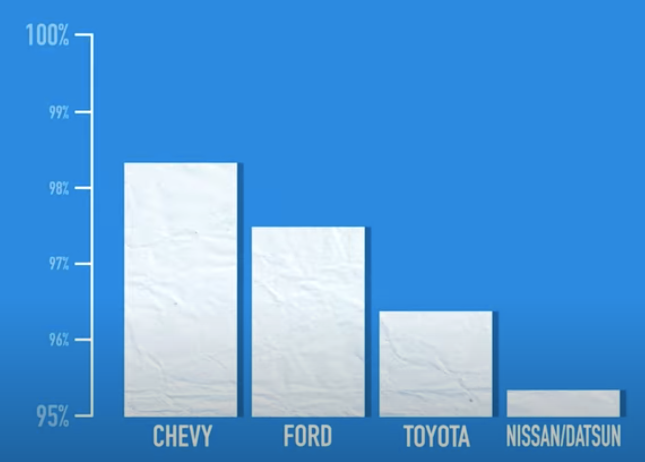
Let's Practice!
Quiz
In the graph above, which element can mislead the reader to assume that Toyota trucks are twice as dependable as Chevy trucks?
Take Action

Share what you learned with a friend.
Recognizing misleading graphs can help us stop the spread of misinformation.
Your feedback matters to us.
This Byte helped me better understand the topic.