
 Image courtesy of Freepik
Think about your morning coffee and your energy level throughout the day. Have you ever wondered if there’s a connection? Let's use the Pearson correlation coefficient to find out how things in our lives might be related!
Understanding The Pearson Correlation Coefficient
The Pearson correlation coefficient, known as "r", is a tool that helps us see the type of relationship between two variables — these are things like your coffee intake and your alertness level.
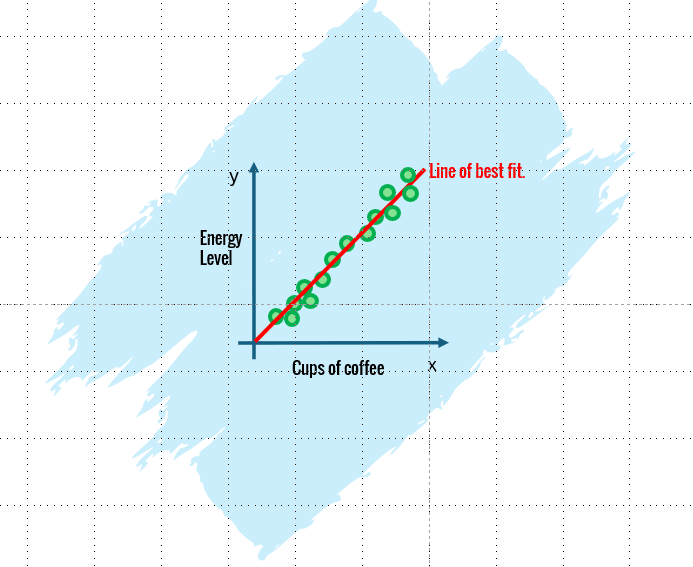
Image created by author using PowerPoint. To hear an audio version of the information in the image above, click the play button on the audio player below:
This plot shows us that drinking more coffee is related to feeling more energetic. If the line of best fit goes up, it suggests a positive relationship: more coffee might mean more energy.
Did you know?
Purpose of the Pearson Correlation Coefficient?
The Pearson correlation coefficient, or "r", is used to:
Determine direction: It tells us if the linear relationship between two variables is positive or negative.
Quantify strength: It measures how strong the linear relationship between two variables is, ranging from -1 to 1.
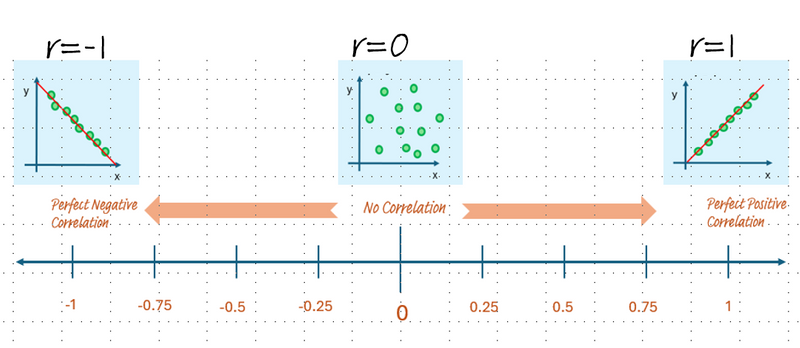 Image created by author using PowerPoint. To hear an audio version of the information in the image above, click the play button on the audio player below:
The closer r is to -1 or 1, the stronger the linear relationship. A positive r indicates a positive relationship (both variables increase or decrease together), while a negative r indicates a negative relationship (one variable increases as the other decreases). A value close to 0 suggests little to no linear relationship.

Quiz: Study Hours & Test Scores
Given a Pearson correlation coefficient of 0.85 between hours of study and test scores, what does this coefficient suggest about the relationship between study hours and test scores?
A. As study hours increase, test scores decrease.
B. No relationship exists between study hours and test scores.
C. As study hours increase, test scores also increase.
D. The more you study, the lower your test scores will be.
Quiz
Select the correct answer to the question above.
Did you know?
How is the Pearson Correlation Coefficient Used in Real Life.
The Pearson correlation coefficient helps turn complicated data into clear insights for real-world use, improving decision-making in various areas. Let's look at some hypothetical examples.
Healthcare
Doctors might use r to check if a new medicine helps patients recover faster (e.g. strong positive correlation, r = 0.8) or if a certain lifestyle factor, like smoking, is linked to a higher risk of disease (e.g. strong negative correlation, r = -0.7).
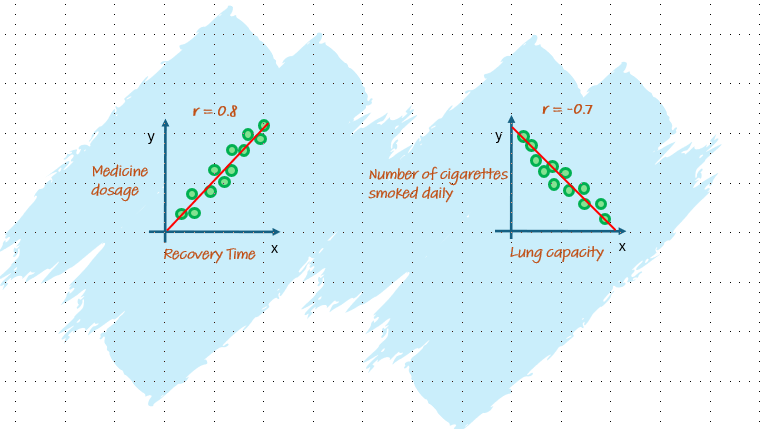 Image created by author using PowerPoint. To hear an audio version of the information in the image above, click the play button on the audio player below:
Finance
Financial/Market analysts might use r to examine the relationship between interest rate increases and consumer borrowing trends (e.g. moderate negative correlation, r=-0.5) or predict the impact of social media post frequency on brand loyalty (e.g. weak negative correlation, r=-0.15).
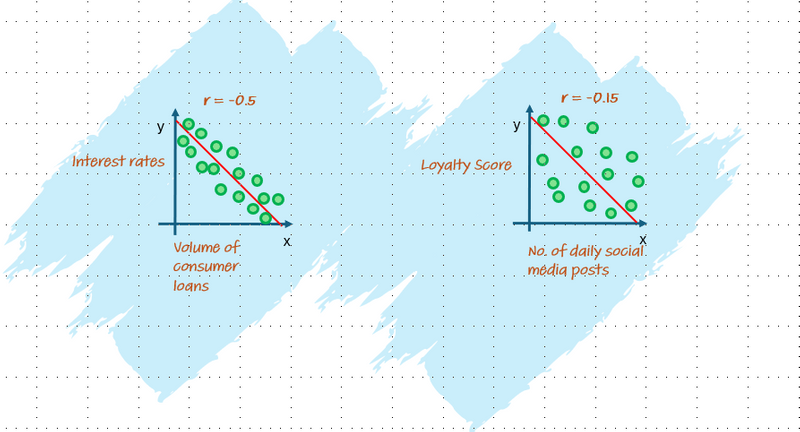 Image created by author using PowerPoint. To hear an audio version of the information in the image above, click the play button on the audio player below:
These hypothetical examples show how r is used in different jobs to study and predict patterns from data, with relationship strengths from weak, moderate to very strong.
Quiz: Physical Activity & Health
A dataset shows that r=+0.65 between physical activity and mental health.

Based on the r= +0.65, what can you infer about the relationship between physical activity and mental health?
A. Increased physical activity is linked to better mental health.
B. Physical activity causes improvements in mental health.
Quiz
Select the correct answer for the scenario above:
Did you know?
Subscribe for more quick bites of learning delivered to your inbox.
Unsubscribe anytime. No spam. 🙂
Take Action

Explore more about the purpose of the Pearson correlation coefficient by taking the following actions.
Your feedback matters to us.
This Byte helped me better understand the topic.