
This logo isn't an ad or affiliate link. It's an organization that shares in our mission, and empowered the authors to share their insights in Byte form.
Rumie vets Bytes for compliance with our
Standards.
The organization is responsible for the completeness and reliability of the content.
Learn more
about how Rumie works with partners.
Reading information that's already out there is great for answering your questions. But what about when you've got a question that hasn't been explored yet, or you just want to see the results first-hand?

💡 You'll need to do primary research by collecting data yourself! One way to do this is with an experiment.
The Scientific Experimentation Process
The scientific experimentation process is there to support or reject what you think might happen in a particular situation.
To carry it out you'll:
Form a hypothesis and prediction
Design an experiment
Record the results
Analyze the results
Share your findings
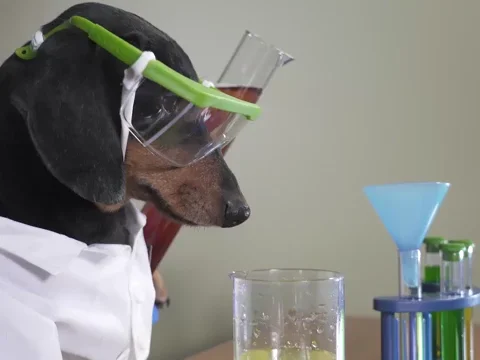
The scientific experimentation process doesn't always move in one direction through the steps. Depending on your goal, you might only complete part of the process and/or skip between steps.
Sunny's Science Fair 🏆
Grade 8 student Sunny needs to use the scientific experimentation process and present his project at the school science fair where it will be scored by a panel of judges. He gets to choose the topic, but the project must be an experiment.
Form a Hypothesis and Prediction
There are many types of studies out there, but an essential part of an experiment is forming a hypothesis and prediction. They need to be testable and falsifiable (could potentially be false).
Hypothesis
A hypothesis is a possible explanation for why something happens the way it does and can be tested.
Rubber tends to be more flexible when it's heated because it is a polymer.
Prediction
A prediction is what you think will happen if you run an experiment and your hypothesis is true (often phrased as "if... then...").
If I drop rubber balls heated to different temperatures, then the hottest one will bounce the highest.
Sunny's Science Fair 🏆
Sunny loves cars and wants to include one in his project. This is his hypothesis and prediction:
A heavier car has more momentum than a lighter car. If I roll a car down a ramp and add more weight each time, then the heaviest attempt will go the farthest.
Quiz
Sunny's hypothesis and prediction are
Sunny can change the car's weight to test the distance it goes each time. If the car doesn't go as far when it's heavier, his hypothesis will be falsified.
Design an Experiment
When you run the experiment, you'll actually change a variable to see the effect on another variable. Both variables must be measurable.
Independent variable
The independent variable is the cause. It is actively changed to see how the dependent variable changes as a result.
Changing the temperature of the room
Dependent variable
The dependent variable is the effect. It depends on the independent variable.
The time it takes for a scoop of ice cream to melt
Control variable
The control variables stay the same to ensure that the independent variable is causing the effect on the dependent variable (and not something else).
The size, brand, and flavor of the scoop of ice cream
Sunny's Science Fair 🏆
Sunny is happy with his hypothesis and prediction, so he will roll a model car down a ramp and add weight to see if it indeed goes farther. The variables in the experiment are:
A. Car's distance travelled after going down the ramp
B. Height of the ramp
C. Weight added to the car
Quiz
Put the independent, dependent, and control variables from above in order:
The independent variable is the weight added to the car, as Sunny is changing it each time. The dependent variable is the distance the car goes, as it will depend on the weight added. The height of the ramp is a control variable, as it will stay the same for every trial.
Did you know?
Record the Results
Consider which information will help you answer your hypothesis and the tools that can measure it:
Temperature ➡ thermometer
Distance ➡ ruler
Time ➡ stopwatch
Record the numbers in an organized table so you can refer to them later. Complete multiple trials (attempts) of the experiment to get an average.

Sunny's Science Fair 🏆
Sunny is in his parents' toolshed borrowing tools for his experiment. On one shelf he sees:

A. A scale that measures weight in grams

B. Masking tape and markers
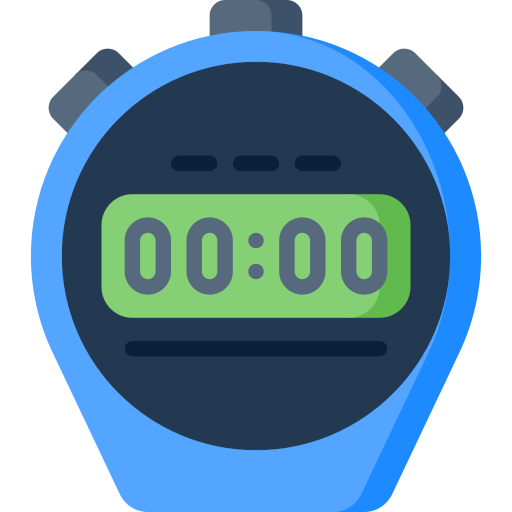
C. A stopwatch that measures time to the millisecond
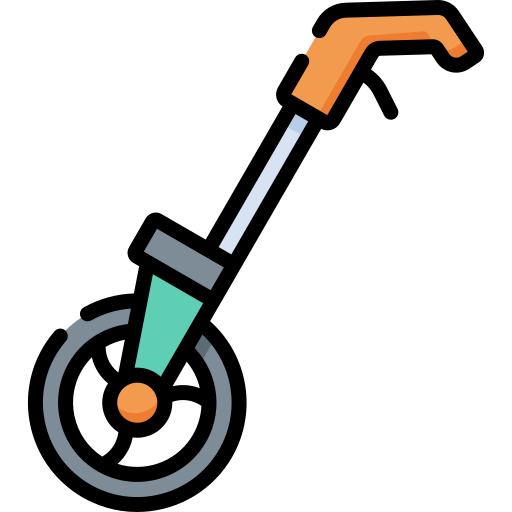
D. A trundle wheel (measures distance in centimeters up to 3 meters at a time)
Quiz
Which tools should Sunny borrow?
Sunny can use the scale to check the car's weight as he adds more, the trundle wheel to measure how far it goes, and the tape and markers to track where the car stopped each time. The stopwatch is not necessary as collecting data about how long it took the car to stop will not help to answer Sunny's hypothesis.
Analyze the Results
Come to a conclusion based on the data you collected and check back to your hypothesis.
Did your data support the hypothesis or not?
I thought that when I dropped two balls of different weights the heavier one would hit the ground first, but they always landed at the same time.
⚠ What if my hypothesis isn't supported?
That doesn't mean you made a mistake! Knowing what isn't true is just as important. Repeat your experiment to add more data points or create a new hypothesis from this information.
I will try the experiment again, but this time I will change the materials of the balls instead of the weight to see if that makes a difference.
Sunny's Science Fair 🏆
Here is Sunny's data:
🚗 500g ➡ 3.1m, 2.9m, 3.2m (average 3m)
🚗 600g ➡ 3.8m, 4.0m, 3.7m (average 3.8m)
🚗 700g ➡ 4.4m, 4.8m, 4.6m (average 4.6m)
🚗 800g ➡ 5.7m, 5.2m, 5.3m (average 5.4m)
Quiz
What can Sunny conclude from this data?
The average distances were farther as the car's weight increased, and since Sunny predicted that this would happen, his hypothesis is supported by the data. If the distance was unaffected or got shorter as the weight increased, Sunny would have concluded that his hypothesis was not supported.
Share Your Findings
Share your full scientific experiment to give your audience a clear understanding of your hypothesis, how you measured data, and your conclusion.
Use visual elements, graphs, and charts, or reports to deliver your message. Consider:
How many people will I need to reach?
What language should I use for them to understand?
Are there any biases I need to address?
Were there any limitations to the experiment?
Quiz
Which components could Sunny include to present his science fair project? Select all that apply.
Providing a visual representation of his results with his materials, a live demo, and a poster will allow the science fair judges to see the work he's done clearly and understand his conclusion.
Take Action
What's something you're itching to know more about?
This Byte has been authored by
Kamelia Valkova
Community Manager at Rumie (and I love nature!)
Kamelia Valkova
Community Manager at Rumie