
This logo isn't an ad or affiliate link. It's an organization that shares in our mission, and empowered the authors to share their insights in Byte form.
Rumie vets Bytes for compliance with our
Standards.
The organization is responsible for the completeness and reliability of the content.
Learn more
about how Rumie works with partners.
Do you need to organize the notes you took earlier in class, or maybe you want to try a more efficient way to take notes?
The charting note-taking method will help you reduce your notes to a minimum and make efficient comparisons of different topics and ideas, enabling you to learn information faster.
The Charting Method of notetaking is a structured technique that involves creating visual representations, often in the form of tables or charts, to organize and condense information.
 Photo by Mick Haupt on Unsplash
Before You Start


Quiz
Which topic would be the LEAST appropriate to use the charting method for?
The Middle Ages in Europe is a vast topic in world history that doesn't necessarily lend itself to being briefly organized into categories and subtopics.
Step 1: Identify Categories and Topics
First, read over the notes you took during the class (or while watching the video/reading the coursebook), then determine the topics, subtopics, and categories.
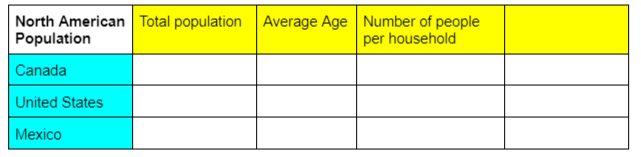
The example below uses the North American population to illustrate how to "chart'' the information.

What is the main topic of the material?
The North American population is the main topic.

What are the subtopics?
Canada, the United States, and Mexico are the subtopics since they are countries within the North American continent.
 What categories can be used to compare information between the subtopics?
The number of residents, average age, and size of household are examples of content that can be compared and analyzed under this specific subject.
Step 2: Create and Fill in the Chart
Draw a chart on a sheet of paper or with Microsoft Word or Excel.
Create columns for the categories
Create rows for the subtopics.
Add an extra column to the right for information that wouldn't fit in the other categories.
Fill in the chart according to your categories and subtopics. Use abbreviations to reduce the notes to a minimum.

Take Action

Use the charting note-taking method for your next study session!
This Byte has been authored by
Charlotte de Poulpiquet
Instructional Designer