This logo isn't an ad or affiliate link. It's an organization that shares in our mission, and empowered the authors to share their insights in Byte form.
Rumie vets Bytes for compliance with our
Standards.
The organization is responsible for the completeness and reliability of the content.
Learn more
about how Rumie works with partners.
Do you want to make sense of inequalities but find the algebra confusing?
Graphing inequalities turns the math into a visual tool, making it easy to see every solution at a glance.
With a few tricks, you'll soon be shading and sketching your way through every inequality!
What is an Inequality?
Definition: An inequality is a mathematical expression that shows a range of possible values, rather than a single solution (e.g., x > 3).
Graphing inequalities helps visually represent all possible solutions and can be useful in fields like economics, science, and everyday decision-making.
A point is within the solution of the inequality if it lies in the shaded zone.
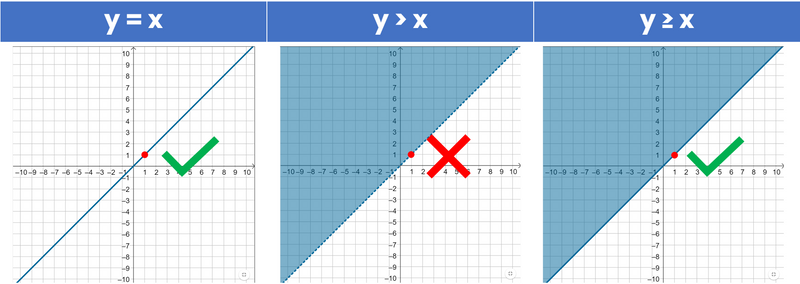
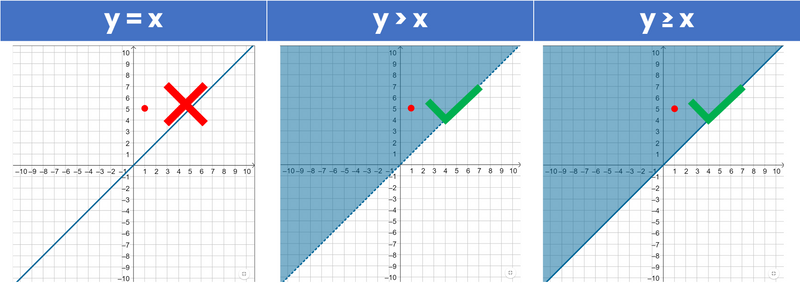
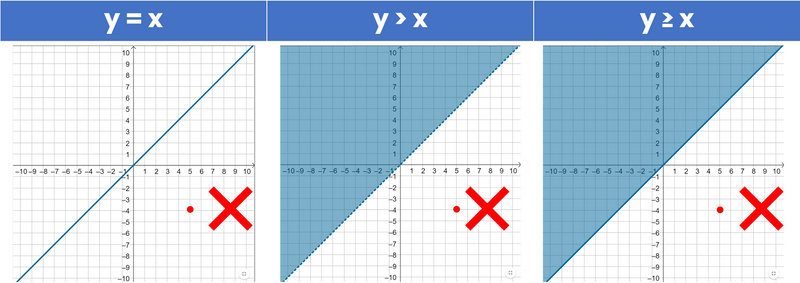 Created by author using Google Slides
Did you know?
The concept of mathematical inequalities dates back to the Greek mathematician Euclid. In The Elements, written around 300 BCE, Euclid presented many ideas about geometric relationships that hinted at inequality concepts. His work indirectly set the stage for understanding inequalities by establishing relationships between figures, a foundational element for modern inequalities.
Understanding Inequality Symbols
Basic Symbols
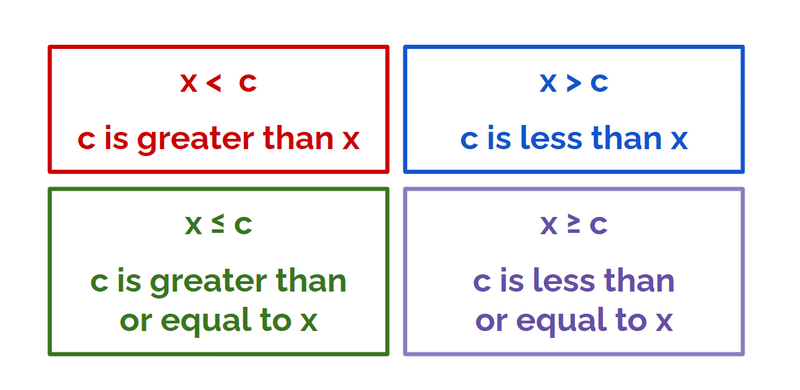 Created by author using Google Slides
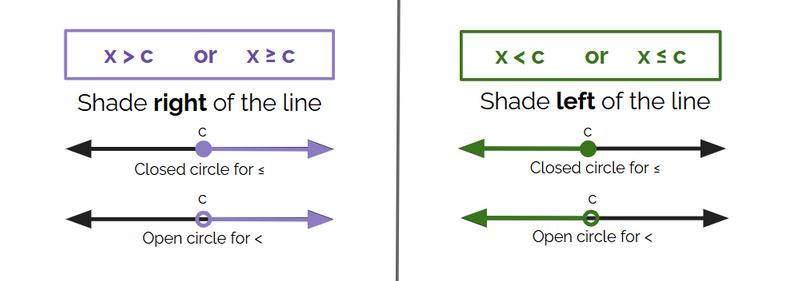
Open vs Closed Circles on Number Lines
Inequalities like ≥ or ≤ use an open circle (the boundary points are included).
Inequalities with > or < use a closed circle (the boundary points are not included).
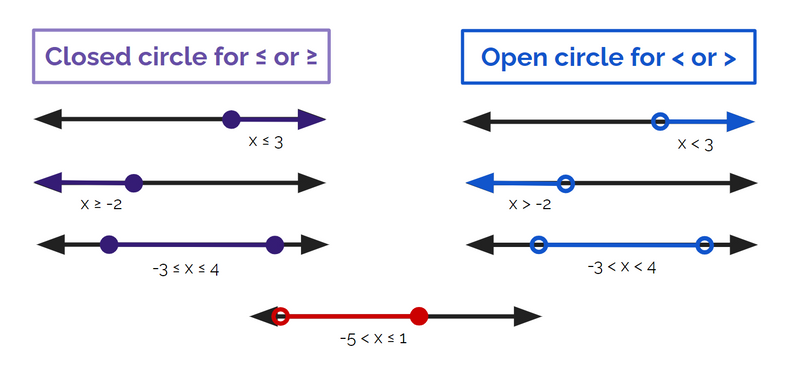 Created by author using Google Slides
Solid vs Dashed Lines on a Coordinate Plane
Inequalities like ≥ or ≤ use a solid line (the boundary points are included).
Inequalities with > or < use a dashed line (the boundary points are not included).
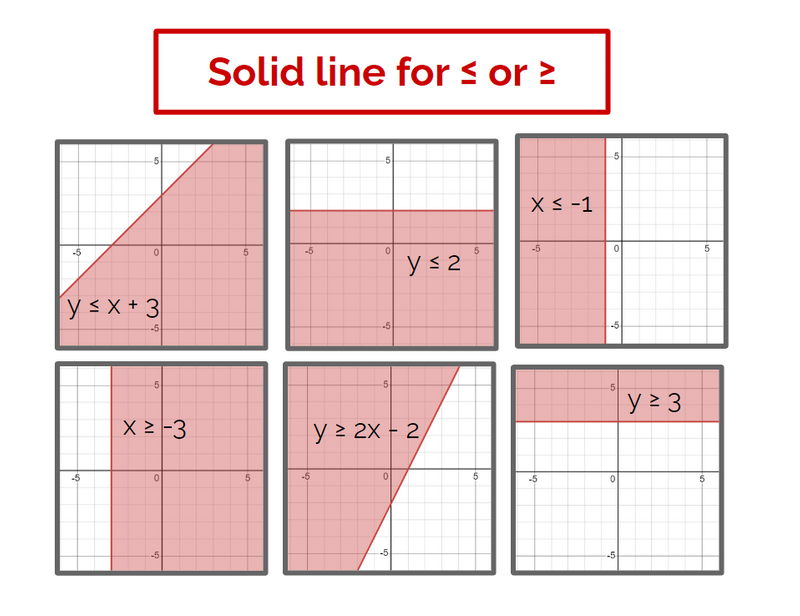
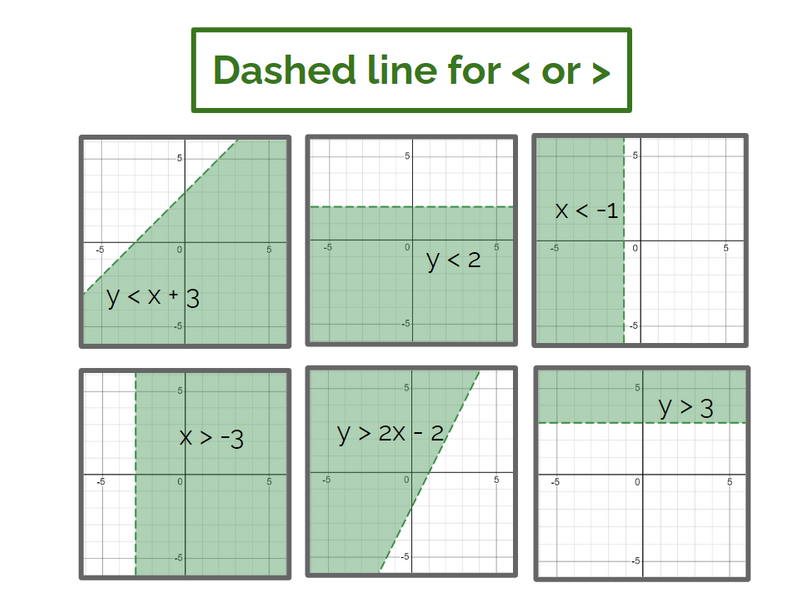
Created by author using Google Slides and Desmos
Graphing One-Variable Inequalities on a Number Line
Example 1: x ≥ −2
x is greater than or equal to -2, so we mark the point -2, shade above -2, and use a closed circle.

Example 2: x < 5
x is less than 5, so we mark the point 5, shade below 5, and use an open circle.

Your turn!
Which number line below represents -3 < x ≤ 1?
A.
B.
C.
D. 
Quiz
Which number line represents -3 < x ≤ 1?
Mark both boundary points (-3 and 1) with an open circle at -3 and a closed circle at 1. Shade between the points.
Graphing on a Coordinate Plane
Graph the boundary line of the inequality as if it were an equation.
Use a dashed line for > or < and a solid line for ≥ or ≤.
Choose a test point (often the origin) to determine which side of the line to shade (or use the image below).
Shade the half-plane that includes all solutions to the inequality.
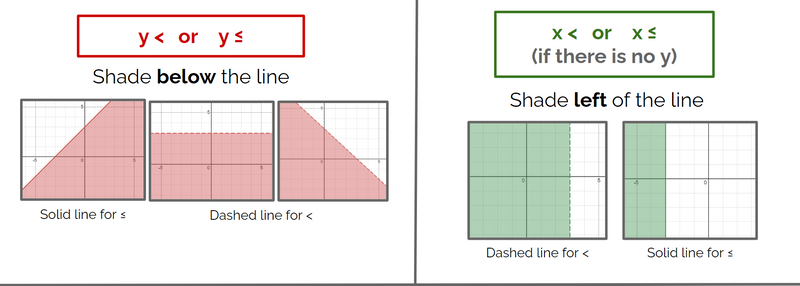
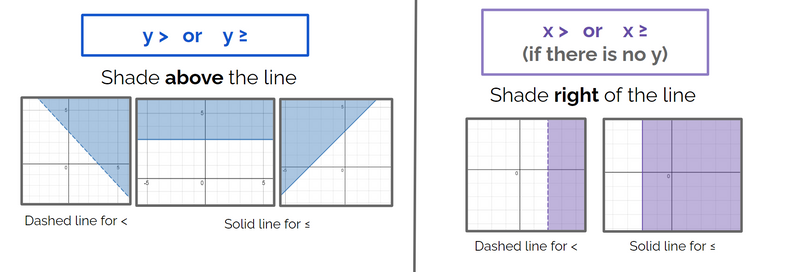 Created by author using Google Slides and Desmos
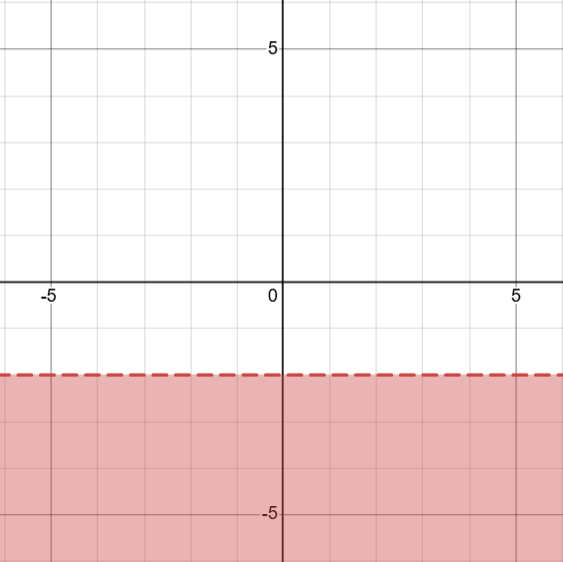
Example 1: y < -2
y is less than -2, so we draw the dashed line y = -2 and shade below the line.
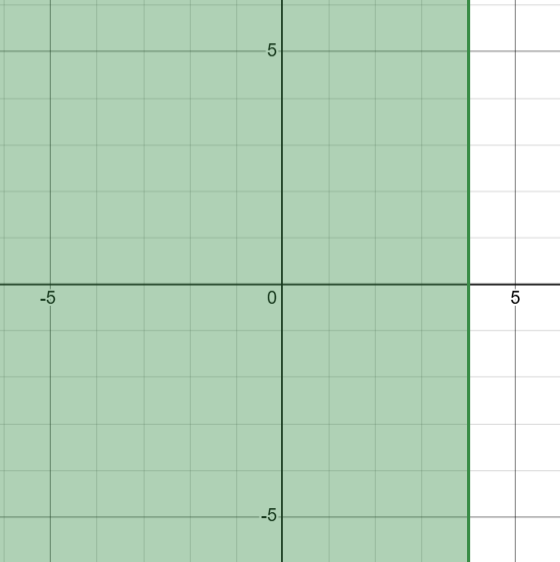
Example 2: x ≤ 4
x is less than or equal to 4, so we draw the solid line x = 4 and shade below the line (to the left).
Your turn!
Which graph below represents the inequality y ≥ -3x + 1?
A.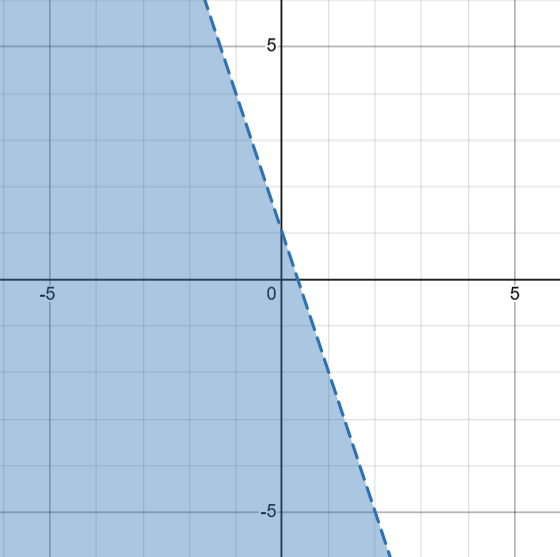
B.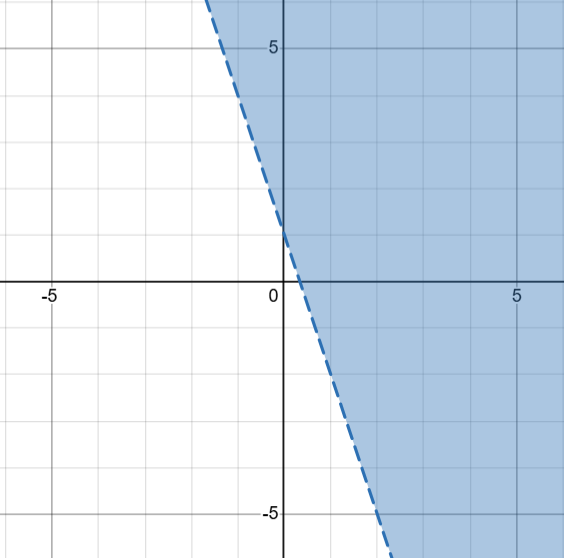
C. 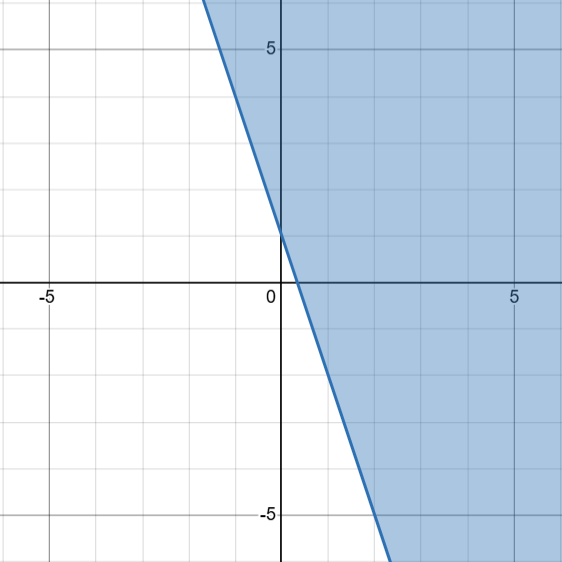
D. 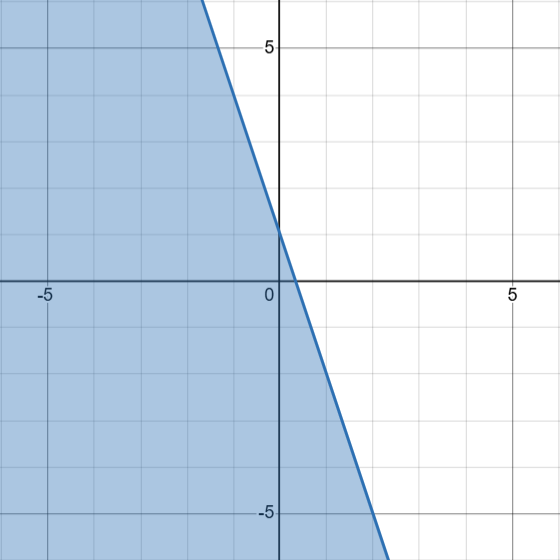
Quiz
Which graph represents the inequality y ≥ -3x + 1?
y is greater than or equal to -3x + 1, so we draw the solid line y = -3x + 1 (with a y-intercept of 1 and a slope of -3) and shade above the line. You can also use any test point to see where to shade.
Graphing Systems of Inequalities
Systems of inequalities: Two or more inequalities graphed on the same coordinate plane, where the solution is the overlapping shaded region.
How to show Ssystems of inequalities visually:
Graph each inequality in the system as a separate line with shading.
Look for the intersection of all shaded regions, which represents the solution set.
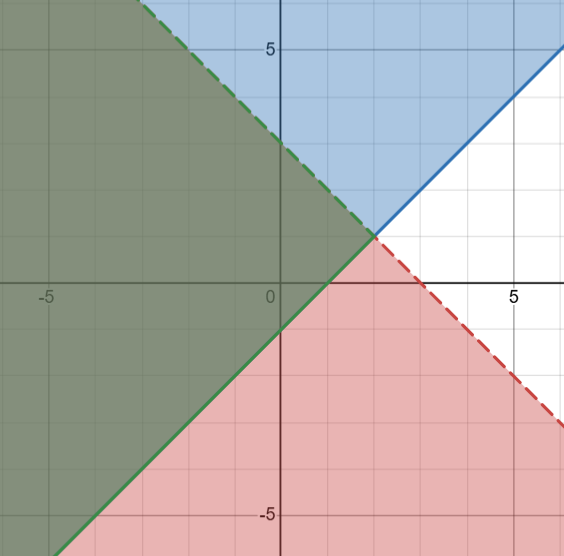
Example: y ≥ x - 1 and y < -x + 3
Sketch the solid line y = x - 1 (blue) and the dashed line y = -x + 3 (red) on the same plane.
y is greater than or equal to x - 1 so we shade above the blue line.
y is less than -x + 3 so we shade below the red line.
The solution is the region that is shaded by both inequalities (green).
 Created by author using Desmos
Your turn!
Which graph below represents the solution of the inequalities y > 2x and y < x + 1?
A.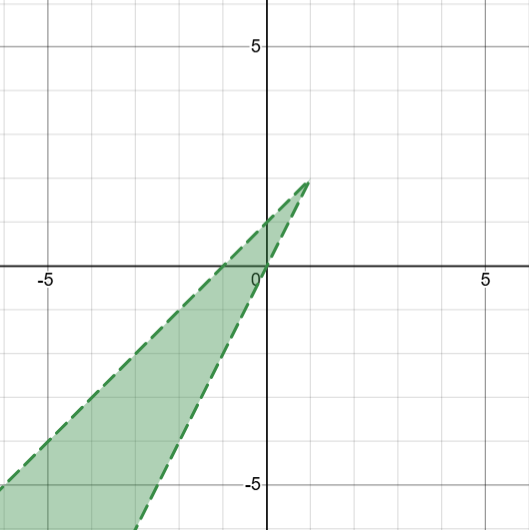
B.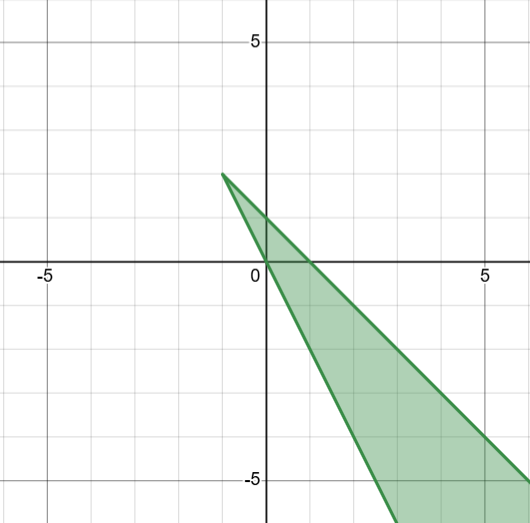
C.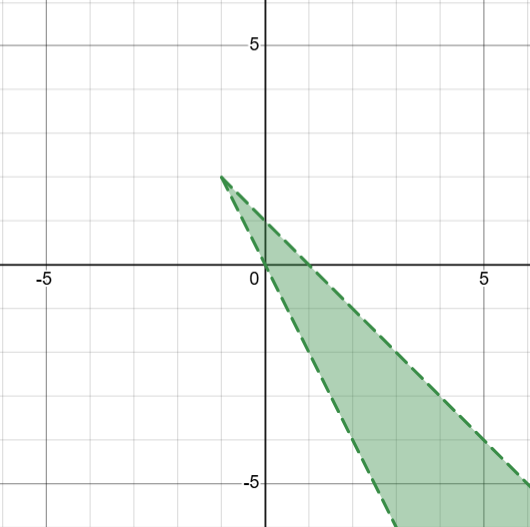
D.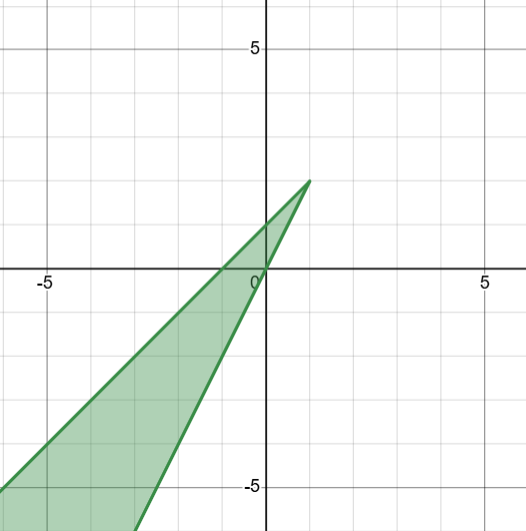
Quiz
Which graph represents the solution of the inequalities y > 2x and y < x + 1?
Graph y = 2x and y = x + 1 both have dashed lines. The shade is above y = 2x and below y = x + 1. The solution is the region that's shaded by both inequalities (A).
Take Action
Now that you've learned how to graph inequalities, practice applying these skills by graphing a variety of examples!

This Byte has been authored by
Christina DaCosta
AI Trainer
Bsc, BEd

