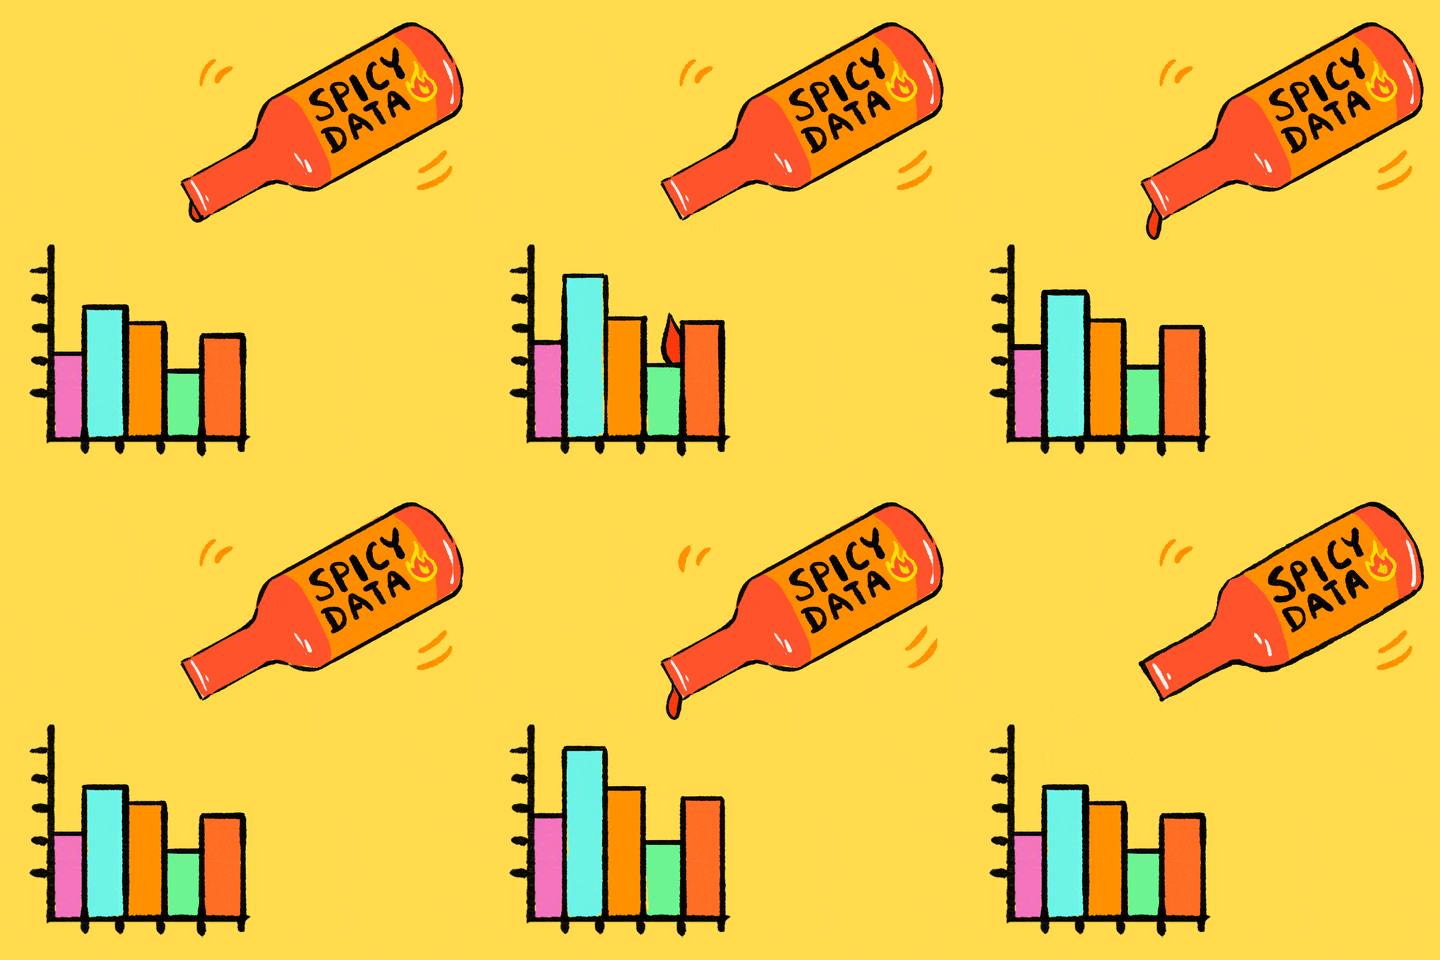
Do you like to dig up unique datasets and present them with engaging graphics?

If the above graphic looks appealing to you, might want to pursue a career as a data visualization specialist!
How Do Data Visualization Specialists Contribute?
Data visualization specialists translate complex statistics and data so that subject matter experts and business users can better understand them.
They help companies make data-informed decisions by presenting data in innovative ways.

What Does A Typical Day At Work Look Like?
Abstract data visualizations involve producing graphical representations of data to present to clients and colleagues.
Data mapping is done at companies that use lots of data across different systems and locations.
Data storytelling is the process of turning data into personalized stories that help customers understand products.
Qualifications
Educational Requirements
You typically need a degree in a subject that develops your analytical skills, such as Maths, Statistics, and Computer Science, although a few data analyst apprenticeships are also available.
Typical employers of data visualization specialists:
Banks
Specialist software development companies
Consulting firms
Telecommunications companies
Public sector organizations
Social media specialists
Does It Pay The Bills?
Average yearly salary for a data visualization specialist in Canada is $68,746
Average yearly salary for a data visualization specialist in the USA is $89,610
Should I Choose This Career?

You'll love the job if you...
Enjoy solving puzzles and playing with data
Have the patience to figure out ways to display data
Have an interest in and appreciation for art and good visual design
Have a degree in math, engineering, statistics, business, or finance
Look for another career if you...
Don't like sitting at a desk all day
Don't like numbers, large databases, and analytics
Don't want to spend a lot of time researching various ways to visualize data
Have difficulty translating data in to compelling stories
Quiz
Loren is great at analyzing graphs and charts, but doesn't like to create them. Would Loren make a good data visualization specialist?
Role Models Of The Field
Alberto Cairo
The Knight Chair in Visual Journalism at the University of Miami's School of Communication
Has written two books on data visualization: The Functional Art and The Truthful Art
Mona Chalabi
The Data Editor at The Guardian U.S. and host of Viceland's The Business of Life
Covered topics such as gun control, sex, and gender politics
Has data visualization sketches on her social media to make data more accessible


Take Action
Do you have some of the skills already mentioned here?
Mapping data
Telling stories through numbers
Visualizing data into pictures

Are you interested in the profession?
Your feedback matters to us.
This Byte helped me better understand the topic.
